 Microsoft announced this month several new features to Powel BI, including data driven alerts that let you receive notifications when the data you care about the most goes beyond the range you set.
Data Driven Alerts
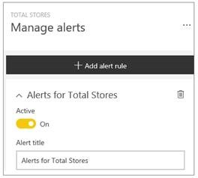
Sometimes knowing about changes to important metrics quickly can give you an advantage or avoid disaster. With data driven alerts in Power BI, you can now get notifications when a metric you care about on your dashboard exceeds a set threshold. Alert notifications will be sent to you as an email, and appear in your notification center on the web and in mobile apps.
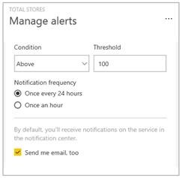
You can set alerts for your numeric tiles featuring cards and gauges. You have control over how often you want to be notified about your data, and whether you want to receive an email when your data goes beyond the limits you set.
Note: only the person who set up the alerts can see them. Even when you share dashboards with others, your alerts are not shared.
RLS Graduates from Preview
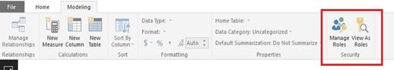
Row-level security (RLS) lets you restrict data access based on who is accessing it. Recently, Microsoft streamlined the process of configuring RLS by exposing roles and rules in Power BI Desktop. Recently, RLS has graduated from preview and is now generally available for all Power BI Pro users. You can now analyze RLS-enabled data in Excel using Analyze in Excel feature.
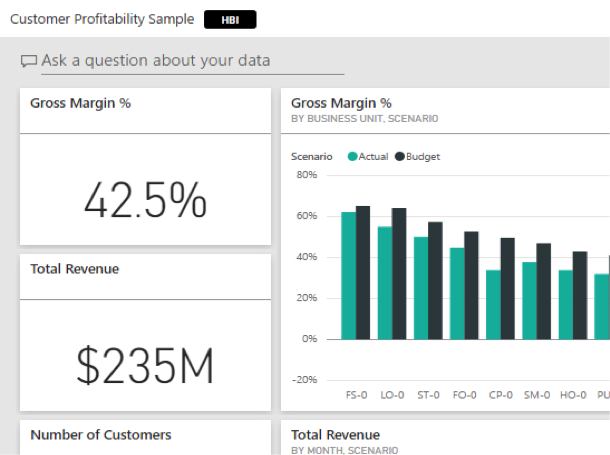
Data Classification
Many organizations have policies for data handling that vary depending on the source of data and how it is used. Some dashboards should never be shared with those outside your company, while others can be shared freely. By using the new dashboard data classification, you will be able to raise the awareness of those viewing your dashboards about what level of security should be used. You can tag your dashboards with classifications defined by your company’s IT department, so everyone viewing the content will have the same level of understanding around the sensitivity of data. You can even link to policy information, so users can learn about proper procedures for handling information.
When data classification is turned on, the tags show up next to the dashboard name to let anyone viewing it know the level of security that should be applied to the dashboard and the data it contains.
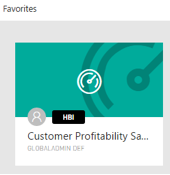
It will also show up next to the dashboard tile in your Favorites list.
When data classification is turned on, all dashboards start out with a default classification type. As a dashboard owner you can change the classification to match your dashboard’s specific security needs.
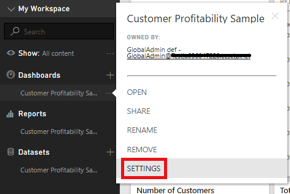
To change the classification type, go the dashboard settings by selecting the ellipsis next to the dashboard name, and click Settings.
Under Dashboard settings, you will be able to see what your dashboard is currently classified as and use the drop-down menu to change the classification type.
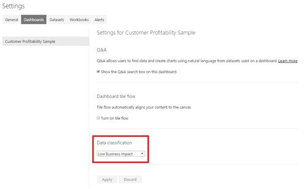
After you apply the change, anyone you shared the dashboard with will see the update the next time they reload the dashboard.
Analyze in Excel
Analyze in Excel has become one of the most popular features! Microsoft has been working on extending the functionality and experiences around this feature. Here are some they enabled recently:
ANALYZE YOUR ON-PREMISES DATA IN EXCEL
You can now analyze your on-premises data in Excel. When you click on Analyze in Excel for your on-premises data, Microsoft establishes a secure and direct connection that enables you to view and analyze it in Excel.
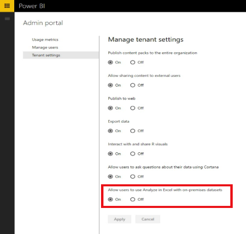
ADMIN SETTING TO CONTROL ANALYZE IN EXCEL FOR ON-PREMISES AS DATA
Are you an admin who wants control over whether or not the users in your tenant can analyze your on-premises data in Excel? You got it! We provide an admin level setting where you can toggle “Analyze in Excel” functionality within your tenant. Note that the feature is on by default. If you don’t want people in your organization to analyze on-premises data in Excel, we recommend you go to your admin portal and turn it off.
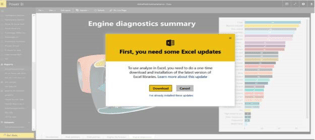
EXPERIENCE AROUND INSTALLING EXCEL UPDATES
Analyzing in Excel is now more smooth.
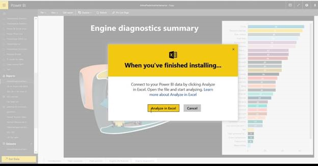
When you select Analyze in Excel, if updates are necessary Microsoft will take you to an experience to download Excel.
After you finish that step, you will be directed to the step to analyze your data in Excel.
Vorsite will continue to keep you updated on new Power BI features. We hope you find these features valuable and if you have any questions please feel free to contact us at (206) 781-1797 or sales@vorsite.com.